Data Comparison
Overview
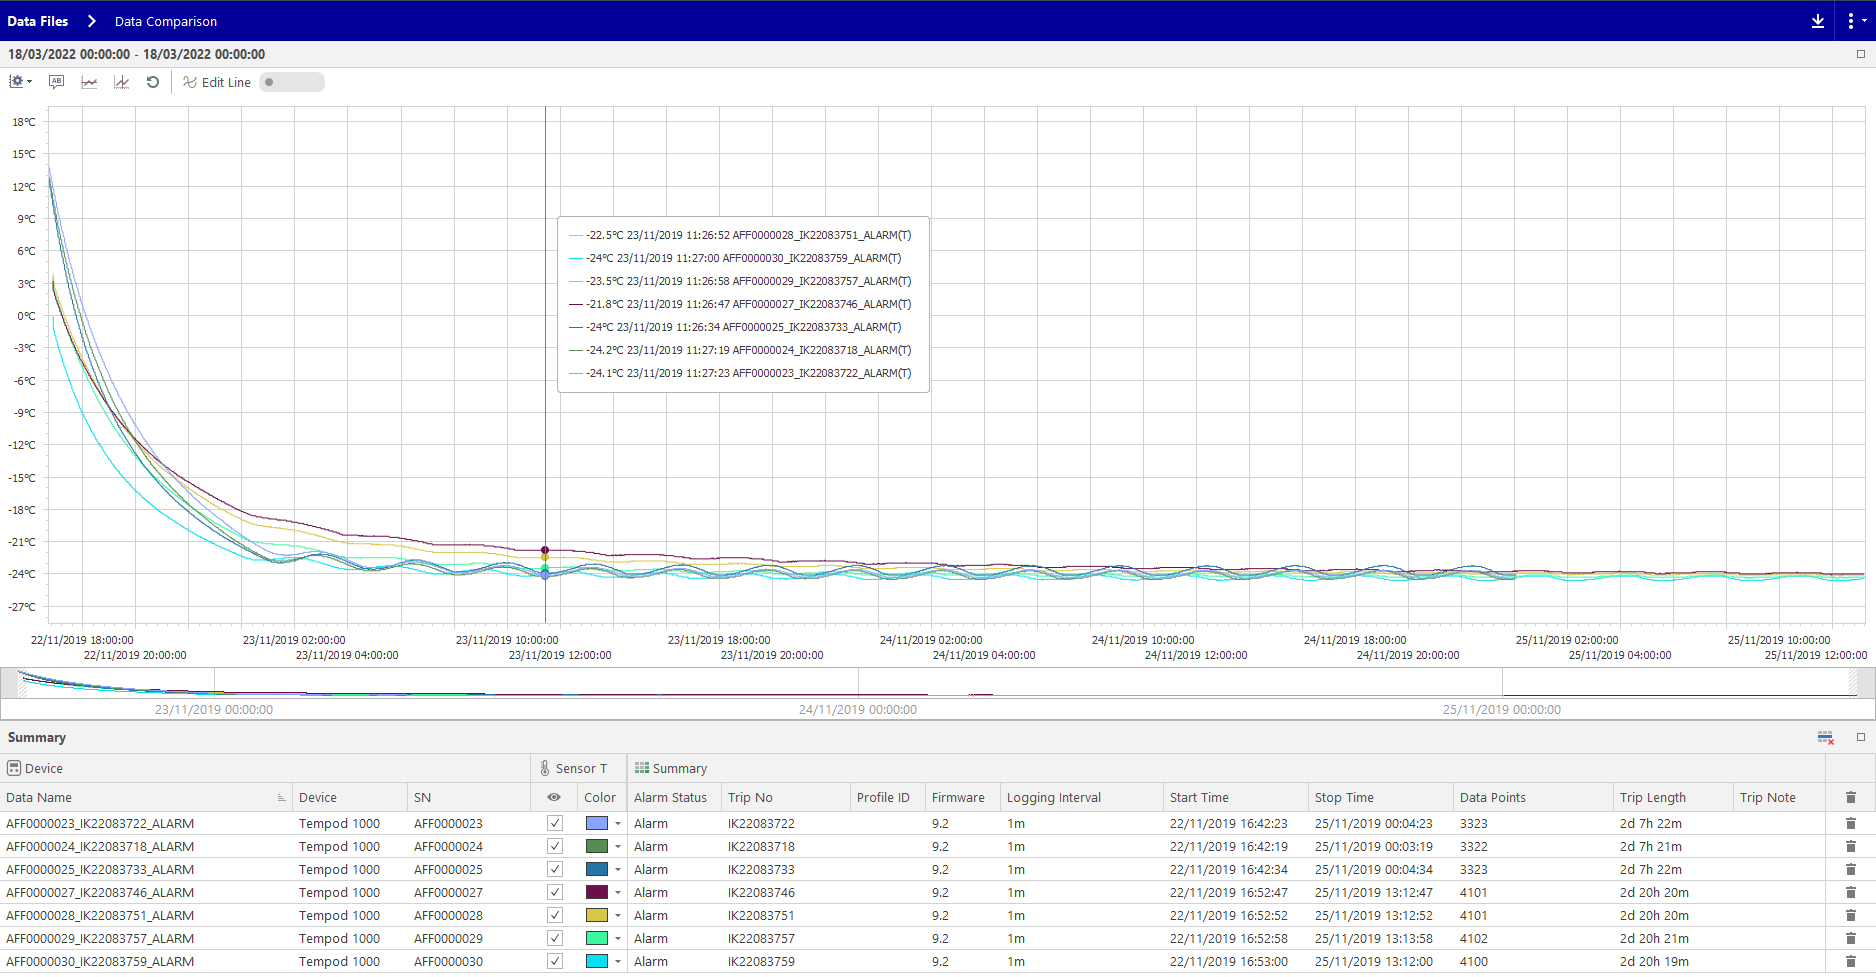
Data comparison allows users to compare up to 50 multiple data files in chart, summary, sensor and data points grid views.
 |
Comparing data files will consume much more memory than viewing single data file, and it may slow down your computer's performance |
Chart View
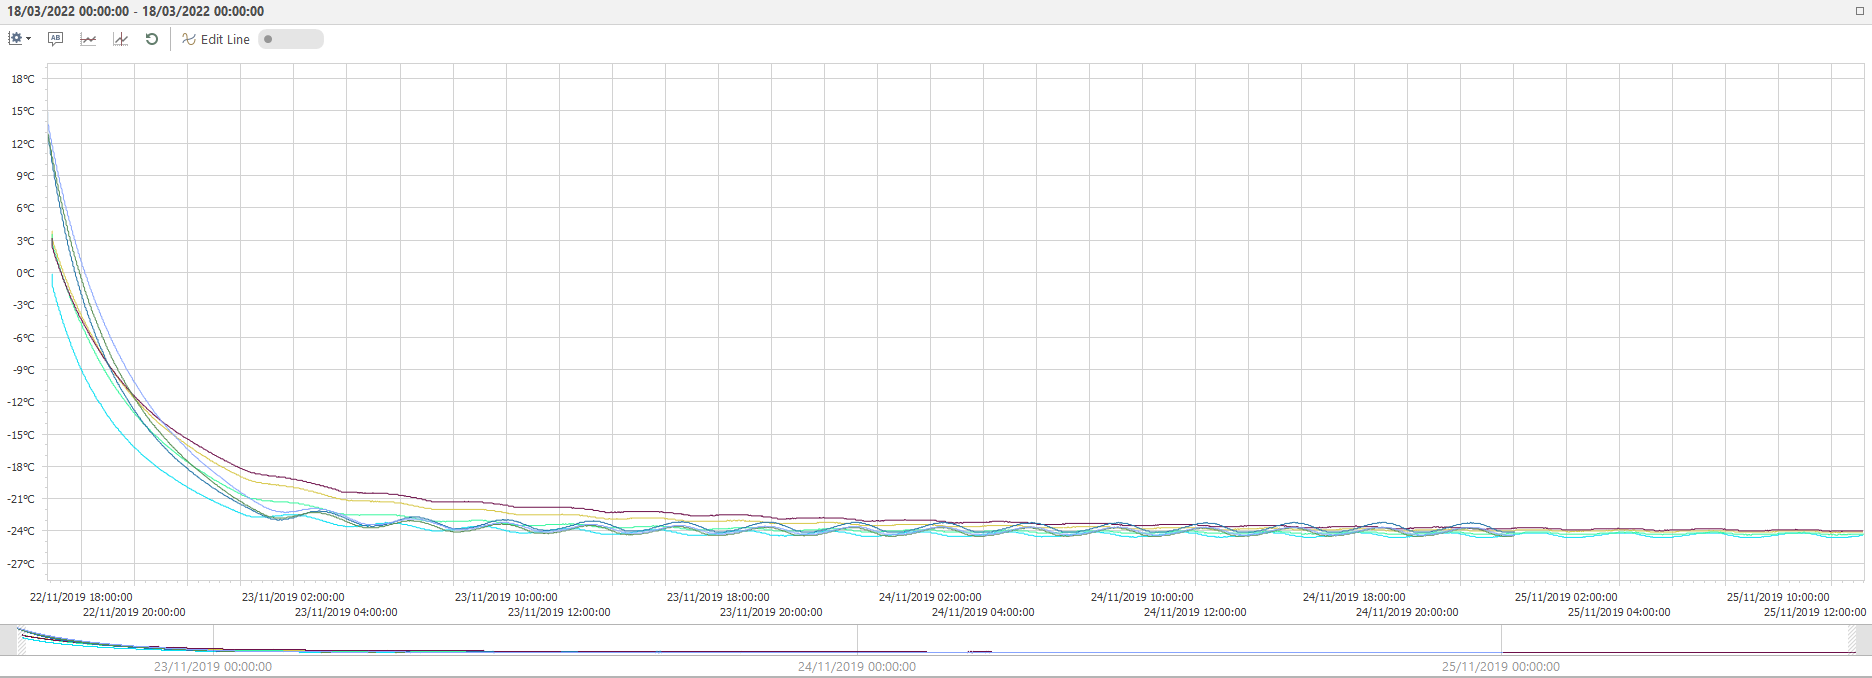
Data point curves of all data files are plotted in one pane of chart
Tempretaure data and Relative humidity data points are plotted in different panes of the chart
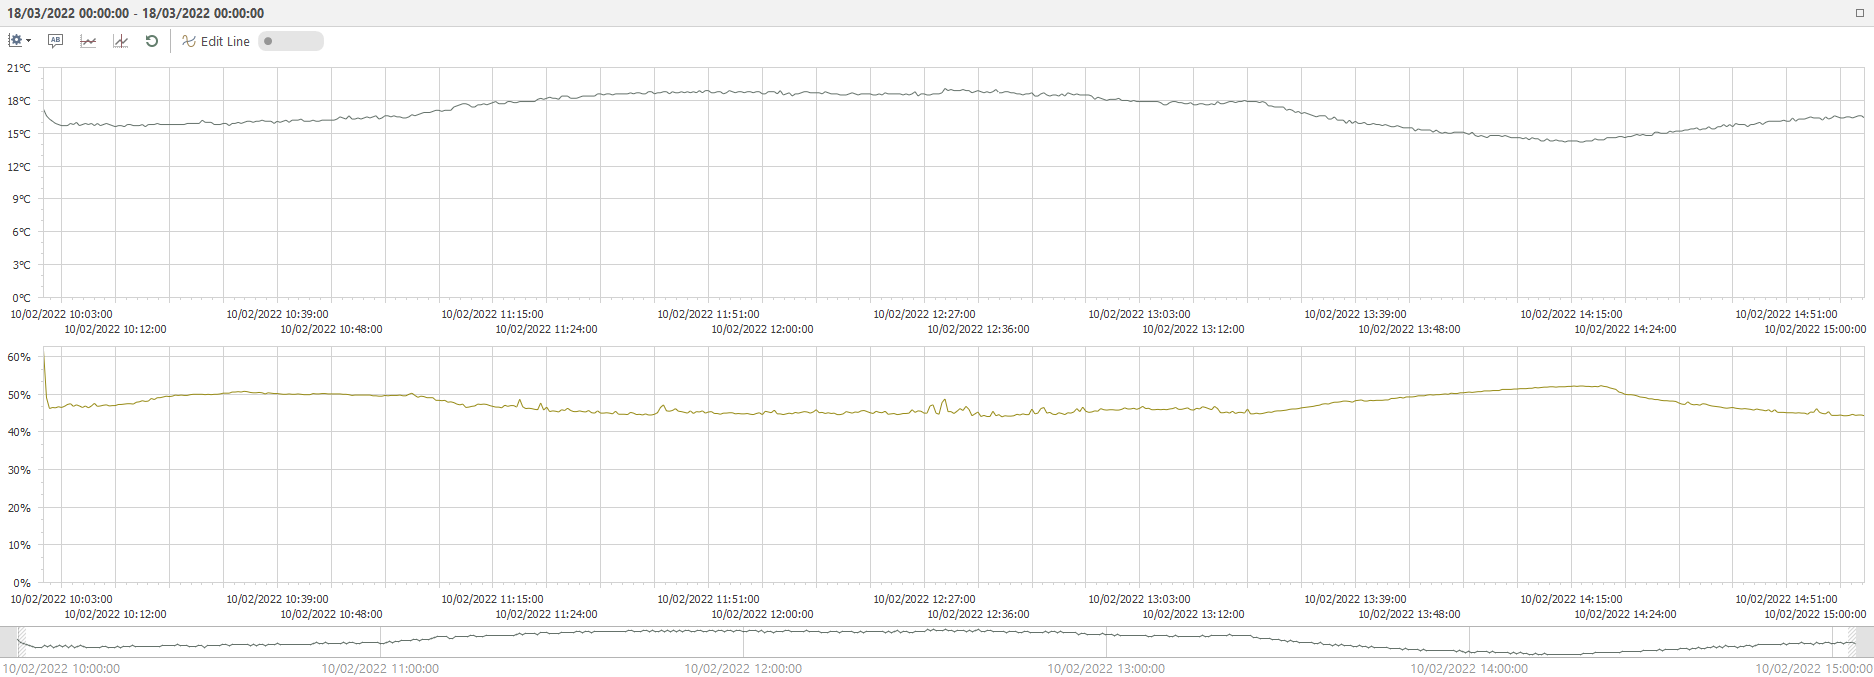
Chart Options
click on chart tool bar to expand chart options menu.
Options:
- Show legend: Show data line legend on chart
- Highlight selected data on chart, data line of data file selected in Summary grid will be highlighted in chart when this option is enabled
- Filter grid data by selected range
- Grid data will be filtered with range selected in time range selector
- Zoom Axis X Only
Chart Actions
Restore chart from after chart being zoomed or time range changed
Add text annotations on chart
 Add custom vertical line on chart
 Add custom horizontal line on chart
 Edit Line, turn on to edit the thickness and marker of data lines in chart, see Edit Line
Chart Docking
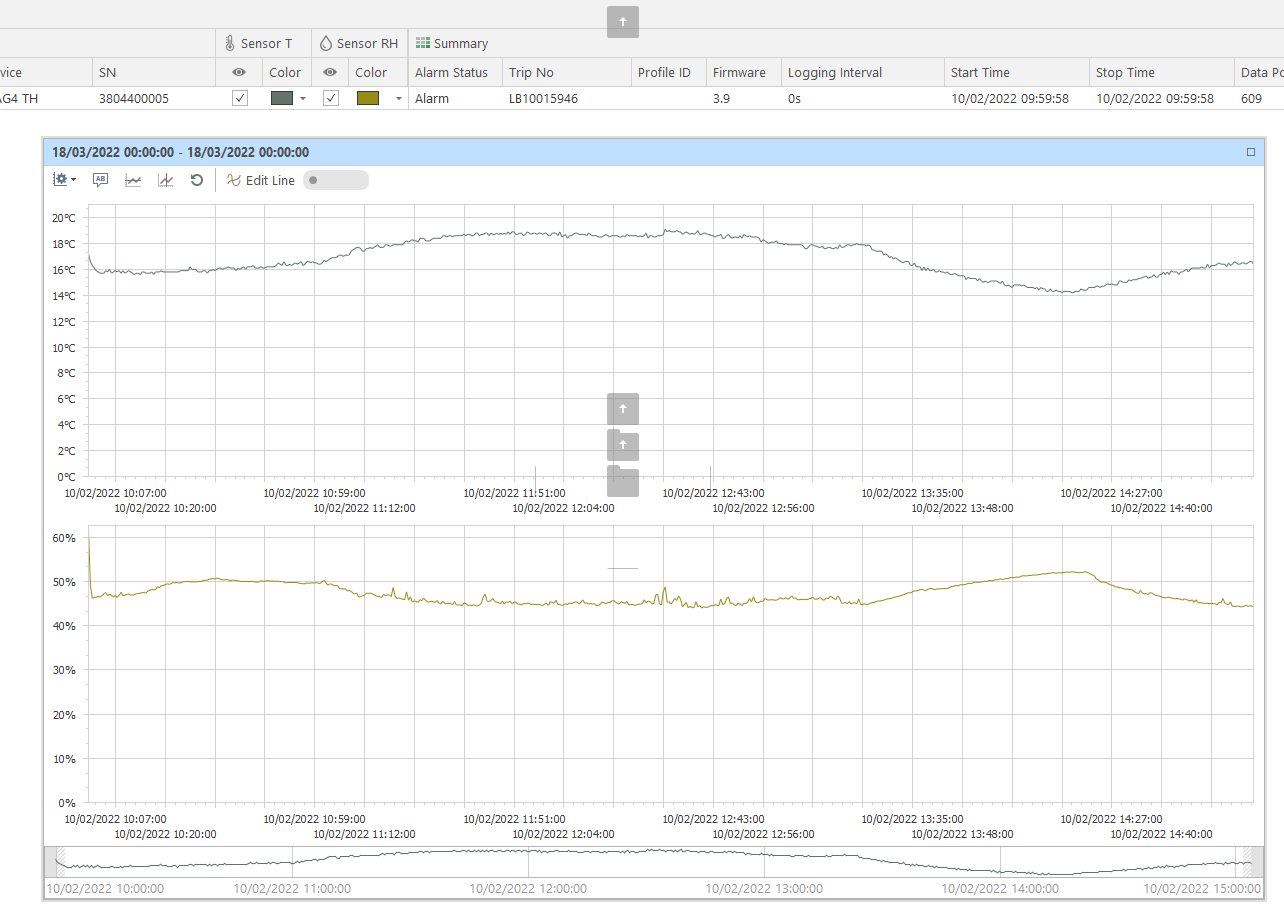
You could click the title bar of the chart and then drag the chart to your second monitor and view the chart in full screen.

And you could drag the title bar of the chart to dock the chart back to the comparison view following the arrows.
Grid View
Summary
Summarized information of each data file in comparison will be listed in Summary grid.

Hide Data Line In Chart
Check or uncheck checkbox in (visibility) column to show or hide corresponding data line in chart
Change Data Line Color
You could change line color in Color column
Remove From Comparison
click in the row to remove the data file from comparison
Edit Line
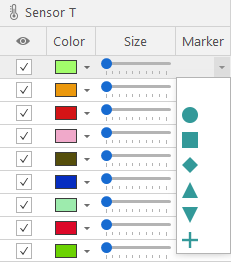
Once Edit Line is enabled in chart's tool bar, the columns of Size and Maker will appear for you to edit the thickness and maker of the data line in chart.
Sensors
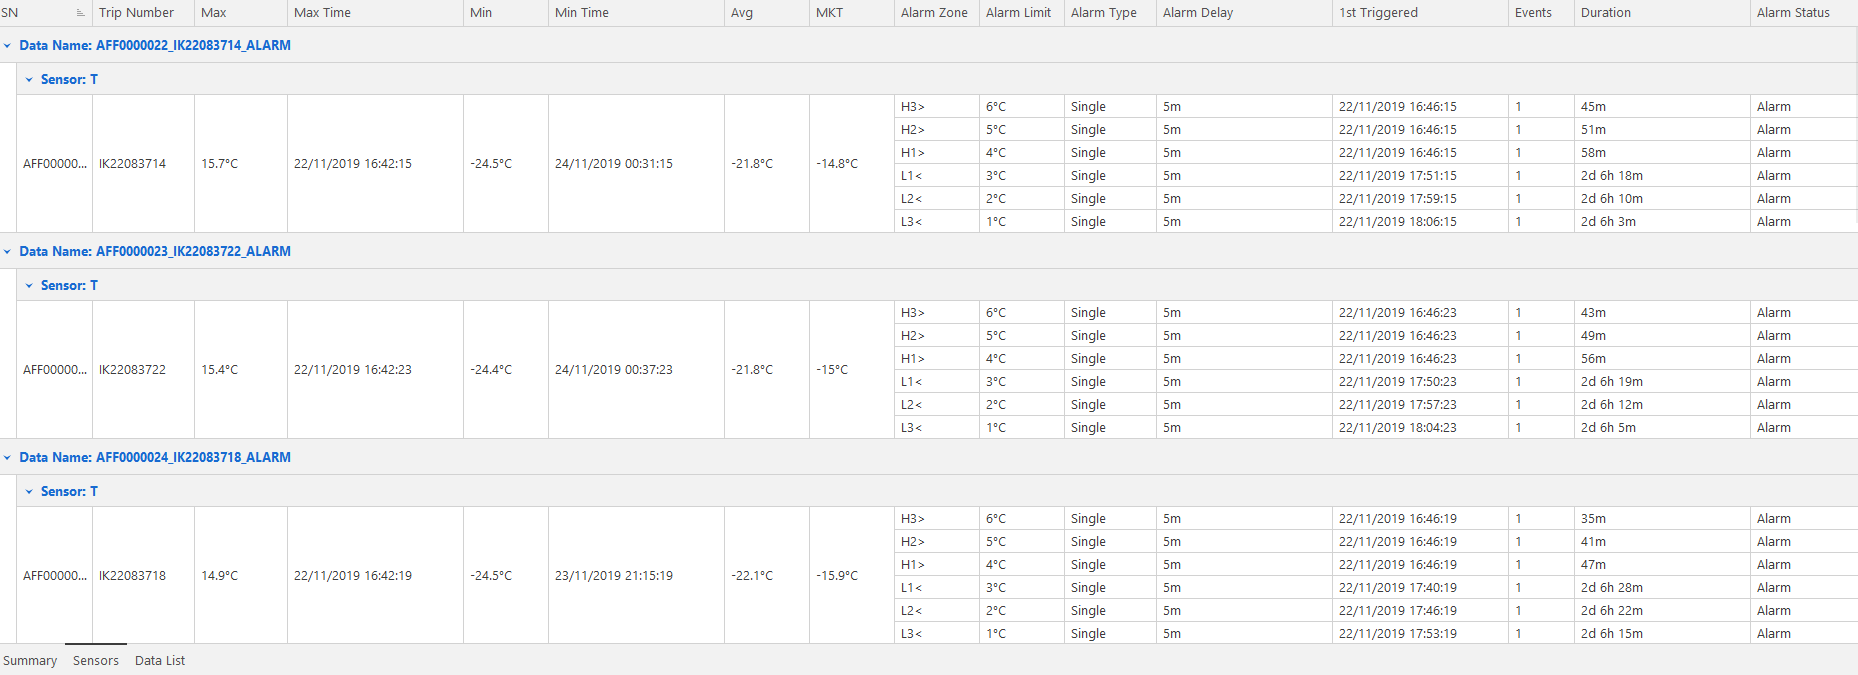
You could compare the recording statistics of each sensor from each data file in Sensor grid.
Data List
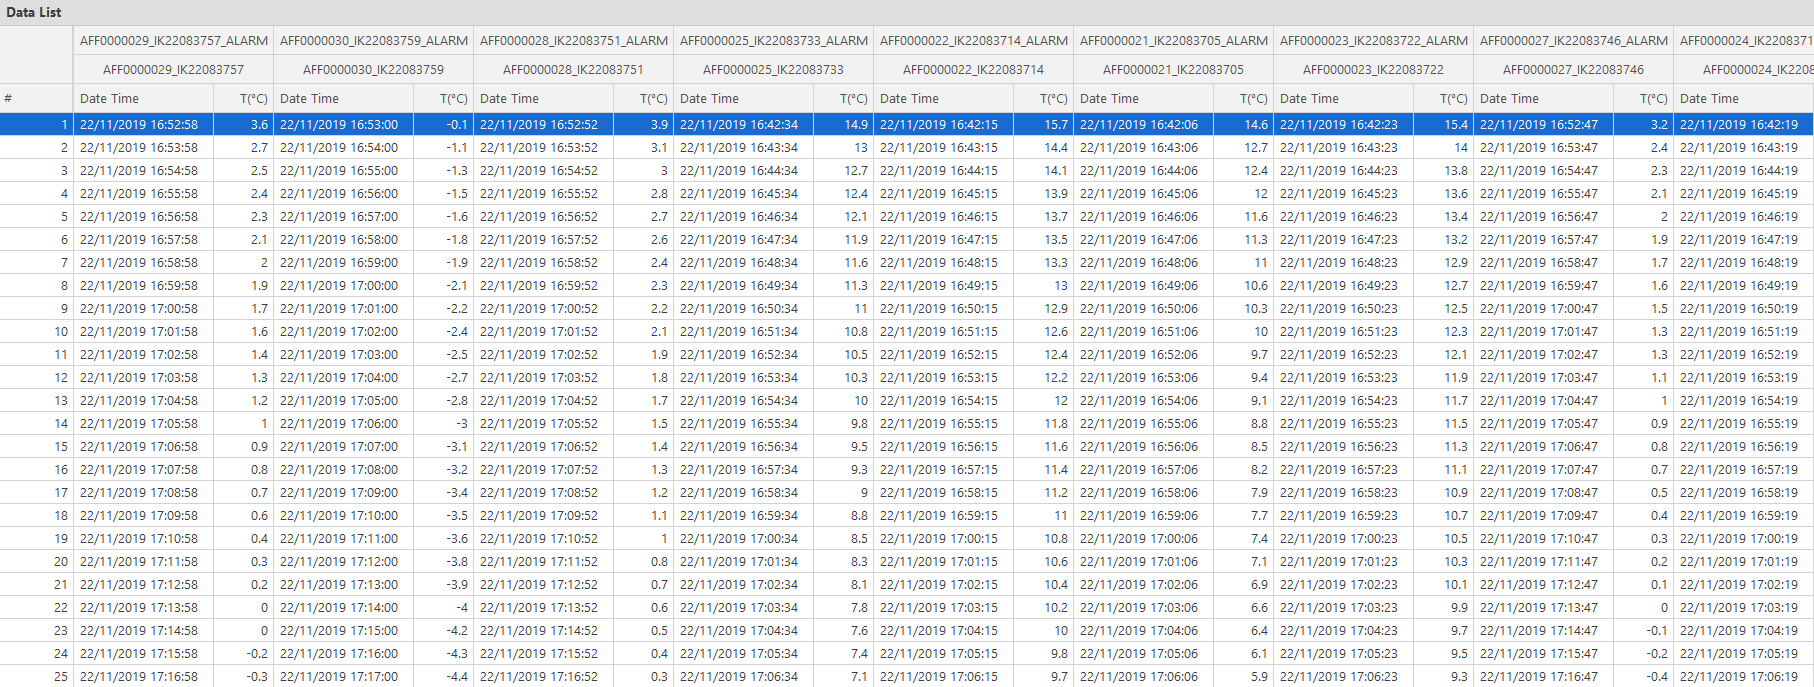
You could compare the the values of all data points from each data file in Data List grid.
Export
click on tool bar to export the comparison data into XLSX file, including chart and all grids.
©TempSen Electronics Company 2023-08-23